
Gentrification of Chinatown - Methodology
- Dec 13, 2021
- 5 min read
Updated: Jan 25, 2022
By Cynthia Tu, Duncan Novak, and Anthony LaBruto
It's very easy to see that Chinatown’s buildings have gotten taller in the last few years, and while we think it spells prosperity for its residents, it appears to be doing quite the opposite. In our Data story: As Chinatown Changes, Asian Residents Face an Uncertain Future, we investigate the land use in Chinatown and why Chinatown is continuously losing its Asian residents.
In order to get a better understanding of how Chinatown is becoming a victim of gentrification, we looked at land use in the neighborhood using the Asian American Legal Defense Fund’s Land Use Map of Chinatown. From here we were able to identify which parcels of land were being in what ways. Our narrative demonstrates a decline in residential buildings in Chinatown from the 1950s onward. A unique point of interest on the map is the amount of institutional buildings that now occupy Chinatown. Emerson College and Tufts Medical Center both hold significant properties in the neighborhood, immediately lowering the possibility for native residents to both own or occupy local land. This map also identifies what it is referred to as missing institutions, such as a library or park. The lack of public services goes back to the demolition of buildings for I-93 in the 1950s and 60s.

This map was very helpful in demonstrating the product of Chinatown’s gentrification, however we needed more specific information in order to supplement our article.
We set out with a few questions in mind:
How has gentrification shaped Chinatown’s land use?
How does gentrification and displacement affect the population and racial demographic of Chinatown?
What does the housing market in Chinatown look like and how does it affect its residents?
How does gentrification affect the residents’ health and well-being?
Cleaning, Analyzing, and Presenting Data
We turned next to Analyze Boston for datasets regarding land use in Chinatown. There is no specific information for Chinatown’s buildings listed on any datasets, but we were able to find a series of master plans of buildings for the greater city. The Boston Buildings Inventory was a great up-to-date resource to get a better understanding of how land was being specifically used in Chinatown. We downloaded a ‘csv’ version of the available data and began to analyze it.

This dataset includes a variety of information, including square footage, build date, assessor tools, owners lists, and addresses. In order to create a visual representation of this, Cynthia created a connection between the zip code in the Building Inventory file and Boston’s neighborhood zip code file that would allow us to see the land use areas by neighborhood in the city of Boston. This gave us insights as to what types of buildings were in the neighborhood.

This visualization showed us what we had previously suspected from the ‘Chinatown’s Land Use’ visualization- institutional land comprised a significant portion of Chinatown’s zonable land. Although this data is from 2013, taking a walk to the testing center, Tufts Medical Center’s footprint in the neighborhood is undeniably large and imposing. We felt that Chinatown’s land use was especially important to note for our overall gentrification analysis.
In order to normalize the data and compare the zoning in Chinatown to other neighborhoods, we analyze the count of buildings of each type with a percentage breakdown.
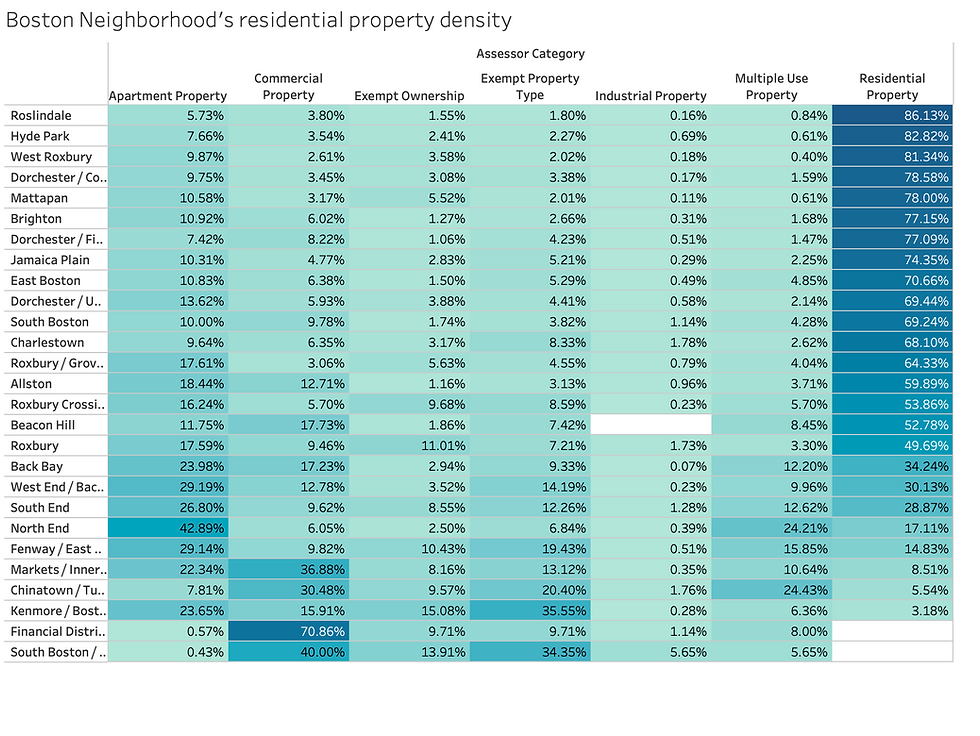

Further analysis from Analyze Boston’s land use guides yielded a surprising discovery: Chinatown had the fourth largest commercial zoned land and the second lowest residential zoned land in the entire City of Boston when compared to other neighborhoods. When referencing Boston, almost everyone would consider Downtown Crossing or the Financial District to be the main center for business, but not Chinatown. The reputation that neighborhood has as being the Asian American residential enclave of the city is clearly challenged when presented with land use analysis.
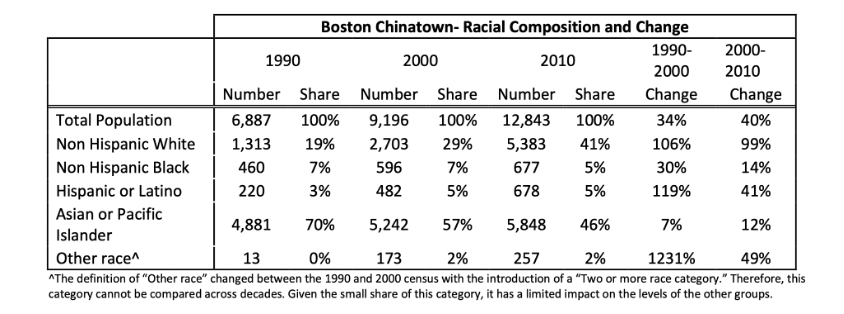
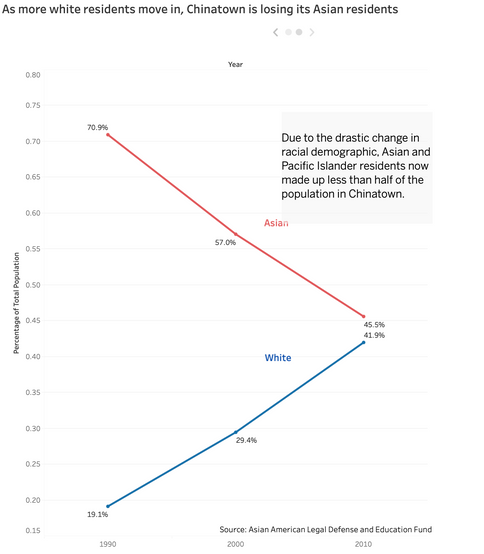
For our next visualization, we wanted to highlight any changing demographics in the Chinatown neighborhood. While we had suspected that this was the case, our data and visualizations wanted to fully support our claim. The chart from AADLEF below showed us that not only was the Asian population decreasing in Chinatown, it was now a minority compared to the percentage of White people in the neighborhood.
Our charts presented our data differently and can be seen here. We wanted to highlight specifically the sharp contrast in race change in the neighborhood over the past 20 years. The line graph shows practically an inverse of race change between White and Asian.


To further bolster our claim that Chinatown was becoming a victim of gentrification, we also looked at several maps that showed rent prices in the City of Boston. One in particular that stood out to us was a heat map of rent prices in the city. Unfortunately, Chinatown rents are just as high as other downtown neighborhoods like the Seaport and Back Bay.
Apartments.com, a popular apartment finding tool, supports this further. Several newer buildings, like the Kensington and 684 Washington street are renting 1 bedroom apartments for as high as $4300 a month. This is simply unattainable for local residents. The picture below also shows a shaded red area, indicating Tufts Medical Center. Their large footprint on the neighborhood has greatly reduced the land available for residential zoning. Developers are clearly taking advantage of this scarcity and are charging ‘accordingly’.
Challenges in Collecting Data
Much to our surprise (and later annoyance), finding information about Chinatown was incredibly difficult. Particularly with continuity information, such as demographics changes over the years, was difficult to find. With racial identification, we were able to deduct that the way in which was categorized had changed over. Asian Pacific Islander was the main term used before 1990, however this changed with the 2000 census noting two separate categories, Asian American and Native Hawaiian or other Pacific Islander. This seemingly minor change greatly limited the demographic data we were able to use for assessment of the neighborhood.
Another frustrating point of interest we encountered was Chinatown’s listing as a neighborhood. While many of the datasets from Analyze Boston included the physical location of Chinatown in land use studies, 311’s, etc., the area was not always listed as Chinatown. For example, a dataset we encountered listed Chinatown’s physical location as being a part of the Downtown/Financial District. Another listed the location as being a part of South Boston. The lack of standardization for location made it difficult to see how Chinatown was actually being affected. Income appeared to be a significant category that varied dataset to dataset. Chinatown’s actual median income levels are much lower than those of the surrounding neighborhoods. If Chinatown was included with the Financial District, the incomes were naturally skewed higher than we knew them to be. The risk we would have taken using this information purely based on geographic location would have severely misrepresented our neighborhood, and in turn the information we wanted to convey. While we know Analyze Boston to be an open source, seemingly transparent datasource, some data sets are very nuanced and require us to look at more than the numbers. We encountered Boston’s housing narrative for Chinatown as very different from what we were originally anticipating.
Thankfully, the Asian American Legal Defense Fund supplemented us with much of the demographic information we used to create our visualizations. We were able to see from their own gentrification study demographic research that we would not have otherwise been able to articulate or access. Their analysis particularly on the wellbeing of residents in Boston’s Chinatown provided us with the necessary information to conclude a key factor in determining the impact of gentrification.
Contribution to the Final Outcome
Cynthia: Outlining, data research, interview, visualization, narrative and methods writing, editing
Duncan: Outline, data research, narrative writing, editing
Anthony: Outline, data research, reaching out to sources, methods writing

Comments